If you’ve ever wondered what happens to NASCAR engines after they blow up on the track, it’s your lucky day. Here is the seriously nerdy failure analysis that goes into making sure those engines don’t fail again.
ECR Engines is a NASCAR engine developer based out of Welcome, North Carolina. Conducting its own research, development and manufacturing, the company cranks out 650 Chevrolet 358 cubic-inch, ~750 horsepower V8 engines each year, primarily for the Richard Childress Racing team.
The group of scientists and engineers recently reached out to me to show the exciting stuff taking place in its metrology lab, a fine-measurements facility devoted to inspecting and analyzing NASCAR engine parts failures, and ultimately figuring out what went wrong.
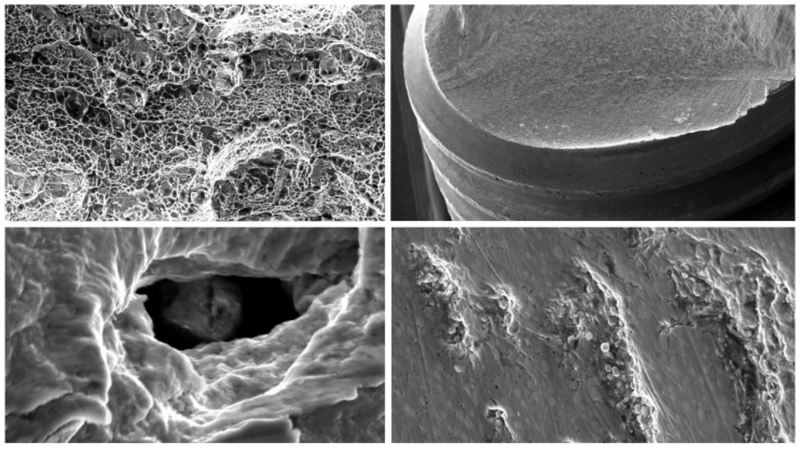
The key piece of equipment in analyzing failure modes is the Zeiss scanning electron microscope, or SEM, which ECR tells me has a magnification capability of over 1 million times. Let’s get straight to it and have a look at some parts failure photos that scientists took with the powerful machine.
Scanning Electron Microscope Images
This first one is a 3,300 times zoomed-in look at a rocker arm, a key component in the valvetrain. The rocker arm gets pivoted in one direction by pushrods to open the intake or exhaust valve, and then in the other direction by a valve spring to allow the valve to close.
But ECR engineers didn’t know the rocker arm was the culprit at the onset, since what sparked the analysis was actually a valve spring failure during a dyno test run, and not the rocker arm itself. After looking at the broken valve spring under the SEM, and noticing striations and arrest marks (indicators of high cycle fatigue failure) but no material defects, the team of detectives took a close look at other parts in the system to see if they somehow contributed to the fatigue failure.
What they discovered in the image above is that that this particular rocker arm hadn’t been properly polished. As a result, the exposed carbides (which are hard and act as an abrasive) from the base tool steel wore into the mating pushrod, causing high valve lash, over-stressing the valve spring and eventually causing the spring to fail.
The image above shows the aforementioned striations and arrest marks on the fracture surface of a valve spring. Such patterns, the ECR team says, are indicators of high cycle fatigue.
The picture above is a farther-out magnification showing subsurface high-stress fatigue failure in a valve spring. ECR says the “fish-eye” radial propagation pattern is a classic fatigue failure giveaway.
But sometimes valve springs, which are under fairly high stresses and cycle 75 times a second, fail for reasons that have less to do with mating components, and everything to do with their own material properties.
The image above, for example, is a close look at a fracture surface of a broken valve spring. The photo shows a five micron-long, sub-surface void in the steel that acted as the origin for a crack.
The team used a spectrometer (a way to tell a material’s composition) to determine that there were still parts of another non-metallic material inside the void. Such a non-metallic impurity is called an inclusion, and in this case, it caused a stress concentration that initiated a crack and failed the part.
In a situation like this, where an engine’s valve spring failed because of a material defect resulting from the steel making process, ECR flags and quarantines the entire batch of valve springs, making sure that no contaminated part goes into another engine. The team might then make changes to the material or manufacturing process to avoid such impurities.
The image above shows a valve spring fracture surface with the “characteristic bulls-eye pattern” of fatigue failure. In this case, the failure started at a small non-metallic inclusion, which is still in place (unlike in the previous photo, which just showed the void).
Again, in this instance, the team would use its Product Lifecycle Database, which traces each serialized individual component in each engine build and determines which batch it’s in—to quarantine other parts that it suspects might be vulnerable to such a defect.
This image shows a main bearing (the one between your engine block and your crankshaft) whose surfaces had undergone fretting damage as a result of what ECR calls “micro-movement” during racing at Eldora Speedway in July of 2016.
The problem, here, was that the bearing halves didn’t have enough “crush” with one another to keep them tight in the bore. So even after the bearing cap was torqued down, the bearing could still rotate a little back and forth about the crankshaft axis, rubbing against the bearing cap. Though this didn’t lead to a failure, the team did make changes to its bearing to ensure proper crush.
The image above shows a connecting rod bolt that failed mid-race at the thread root because of bending fatigue, sending the connecting rod shooting straight out of the oil pan in a catastrophic turn of events.
A bolt holding the connecting rod cap had bottomed out because the connecting rod hadn’t been machined properly. This meant that, though the engine assembler applied the appropriate torque to the bolt, the threads weren’t producing the clamping load necessary to overcome the inertia from the connecting rod and piston at high engine speeds.
The result was that the bearing cap actually wanted to move away from the connecting rod, stretching the journal bore, and putting the rod bolt under cyclic fatigue, ultimately breaking it on the fracture surface shown in the picture above.
Sometimes, like in the case of the connecting rod bolt, scientists see only part of the fracture surface riddled with striations (indicators of fatigue). That’s because, after the fatigue crack has propagated far enough, the part runs out of cross-sectional area to withstand the stresses, and fails almost instantly.
The picture above, which shows “microvoid coalescence” on a connecting rod, provides a visual for how such an instant ductile overload scenario looks under the SEM.
This image is not so much a failure, as it is a cool research photo of a “micro-crystalline phosphate pretreatment,” whose aim it is to improve break-in properties of steel parts. The coating’s main job is to retain oil, so as to reduce initial wear to a camshaft or a lifter, for example.
Similar to the previous image, this SEM picture shows a “Physical Vapor Deposition,” a three to five micron thick thin-film coating that ECR puts on much of its engine parts.
The hard coating offers good wear properties and low friction, but it’s only as good as the part to which it is applied, ECR’s analyst Jim Suth told me. The one in the image above, for example, was machined but unpolished, allowing the peaks (dark lines) in the material finish to poke through the coating, and expedite failure of mating parts.
How ECR Does Its Testing
In most cases, the parts that pass underneath the lens come from engines that have failed while undergoing dynamometer testing. ECR actually has an engine speed versus load map that simulates the operating points an engine might see during, for example, the Coke 600 (the longest race of the season). Technical director Andy Randolph told me: “[ECR] can run full races from any track in a highly instrumented laboratory environment.”
And though dyno tests aren’t perfect (the lab can’t simulate lateral acceleration and the effects on oil flow, for example), by running the engines at operating points similar to real life, observing failures, and then putting the failed components under a microscope, ECR hopes to have all of its engine component failures up front, before race-day. Though sometimes, that’s not always avoidable.
Ryan Newman, for example, lost his engine halfway through the race on Saturday in Kansas due to what he thinks was some sort of bottom-end failure, he told Paddocktalk. ECR took that engine back to its facility on Sunday, and tore it down to understand the root cause. The team is still working on that now, but they will have an answer soon. This, ECR told me, is a good example of how quickly the team sometimes has to work to resolve and prevent future failures; in some cases, the scientists have to troubleshoot a failed engine within only a matter of hours.
To conduct such a thorough investigation in so little time, ECR begins by gathering all background information for the incident. For example, if the failure happened on a dyno, what was the test schedule being run? If the engine died during a race, where was this race? What can the driver or dyno operator tell us about events leading up to the failure? (This latter part can be dangerous, because you don’t want preconceptions about what happened to lead you down a path; it’s best to let the data talk, analyst Jim Suth told me).
To learn more about the events leading to the breakage, ECR analysts can also look at a number of engine parameters, since they’re always being monitored on the dyno. Some of this data is available after a real race, too, since ECR can download telemetry from the car’s ECU. The telemetry includes sensor readings like fluid temperatures, engine speed, throttle position, engine vacuum, oil pressure, and a lot more.
After gathering the background info, the team tears the failed engine apart, snaps lots of photos, and then engineers begin searching for primary and secondary failures, using the background information as guides.
Sometimes distinguishing between primary and secondary failures on an engine that can spin at 9,300 RPM is a tall task that depends a lot upon how quickly the driver or test operator could cut off the engine after they noticed a failure. If it takes too long, counting cumulative fatigue cycles can become difficult, as fracture surfaces are damaged, as are other nearby engine components. The broken nearby components can muddy the water on identifying a primary failure from a secondary.
Since it focuses on this one 358 cubic-inch pushrod V8 engine, ECR is acutely familiar with what sorts of things can bring about failures in certain parts. But when the team is not sure, it just looks at fracture surfaces (sometimes only a small undamaged fracture surface remains after a multiple-part failure), identifying fatigue or overload failure modes.
When there are a number of broken components, parts that have overloaded or broken in a few cycles (low cycle fatigue) tend to be secondary failure modes, whereas high cycle fatigue is often the primary culprit. So one by one, the team analyzes the fracture surfaces to separate different failure modes, and narrow down the root cause. If there are just one or two broken parts, it’s a lot easier, and sometimes just takes a quick look at the parts under a low-magnification (20-30x) stereomicroscope.
Sometimes there’s a failure (of a valve spring, for example), but no material defect at the crack origin, and no obviously worn out rocker arm that could have caused an over-stress situation. In such a case where the materials seem to check out, the team has to dig deeper into the system. Perhaps, for example, it might analyze whether its camshaft profile was too aggressive for the spring material.
Why This Nerdy Stuff Matters
Understanding failure modes helps ECR engines get a competitive advantage by optimizing components for the best balance between engine durability and performance.
And if you’re wondering just how much development work is involved with engines that are heavily regulated by NASCAR, the answer is: quite a lot. Technical director Andy Randolph broke it down for me, saying that, even though NASCAR specifies the engine architecture (“number of cylinders, maximum displacement, maximum bore size, valvetrain layout”), there’s a lot of room for engine shops to improve performance of parts constrained by the rules (for example, by making changes to the material, surface finish, coatings or tolerance).
He went on:
In addition to these considerations, design of parts with rules flexibility are optimized through computer modeling and testing to produce the best power curve for each track we visit. For instance, valve timing, intake runner lengths, exhaust header geometry, intake and exhaust port design, and engine calibration are adjusted on an individual cylinder basis to produce the desired overall power curve. NASCAR mandates intake manifold, cylinder head, and block castings at the manufacturer level, but the machining and subsequent optimization of these castings is at the discretion of the individual engine shops.
So despite the standardized engine geometry and valvetrain layout, there’s still a lot of material science that goes on in these engine shops. And arguably the most exciting part of that material science work happens right under the barrel of a scanning electron microscope, where scientists try to unravel the mystery of why their engine blew up.