Bragging Rights: USA TODAY Sports College Football Conference Rankings – USA TODAY
It used to be that college football fans cared if their team was better than your team. Now they also care if their conference is better than your conference.
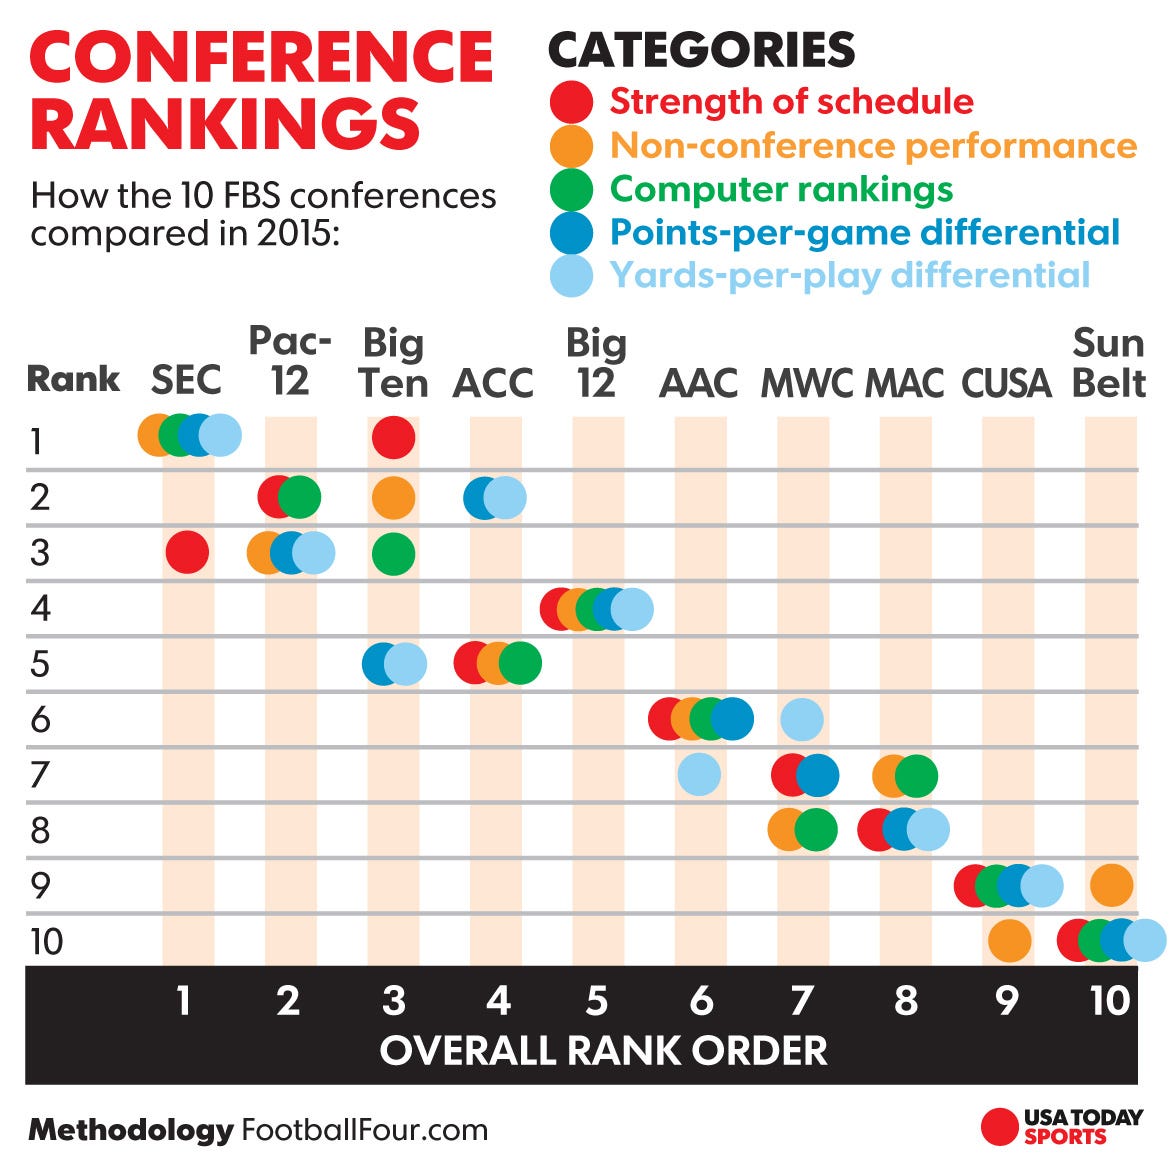
We at USA TODAY Sports wanted to help clarify the answer by collecting and analyzing performance data for every FBS team in every conference. By combining strength of schedule data, rankings from the College Football Computer Composite, points per game differential, yards per play differential and a new metric called Non-conference Performance, we’ve created the USA TODAY Sports College Football Conference Rankings.
What you see below is the starting point, with this initial ranking based on final data from the entirety of the 2015. Full methodology on each category is explained in the final section of this story.
Where do the conferences go from here? We’ll monitor throughout the 2016 season in USA TODAY and on FootballFour.com.
1. Southeastern Conference
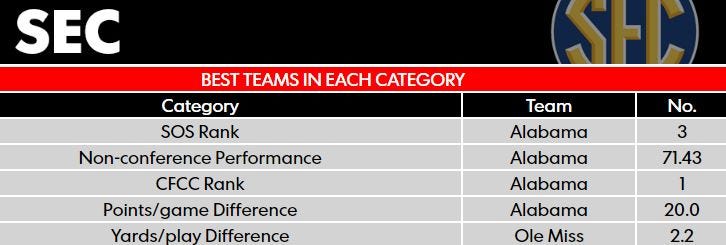
The SEC plays the best defense in the FBS, and of all the categories it led in this analysis, its YPP differential stood out at almost double the second-place league. A testament to the SEC’s top-to-bottom strength is the fact that two teams considered to have had subpar seasons in 2015 — Auburn and Missouri — had two of the top 10 strongest non-conference performances in the FBS. Over all the league was 13-6 vs. non-conference Power Five opponents, best of any league.
2. Pac-12 Conference
This 12-team league’s depth of quality teams showed, as it never ranked worse than third in any of the five analysis categories. The Pac-12 joined the SEC as the only leagues without any teams with negative non-conference performance scores, and Utah gave the league one of the best non-conference wins of the season in beating Michigan. But what separated it from the SEC were agonizing missed non-conference opportunities by some of its better teams, such as Stanford falling at Northwestern, Oregon blowing a 31-point lead to TCU and Washington State losing to Portland State.
3. Big Ten Conference
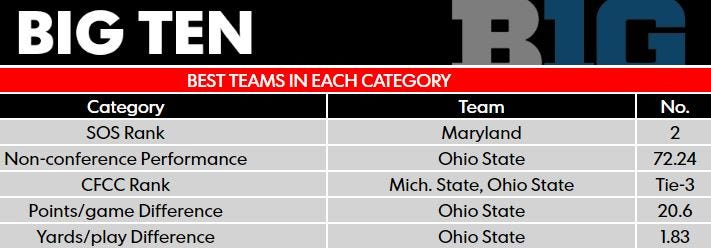
The Big Ten was the only conference other than the SEC with a .500 or better record vs. non-conference Power Five competition in 2015. It was slightly better than the Pac-12 in schedule strength and non-conference performance and slightly worse in the computer rankings, points and yards allowed. In 2015, the Pac-12’s best were on par with the Big Ten’s best, but the Pac-12’s worst was better. That can make the difference. Like the ACC and Big 12, one result can decide who ranks better between the Big Ten and Pac-12.
4. Atlantic Coast Conference
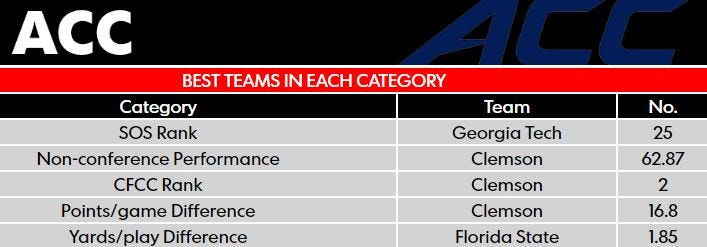
The ACC had one of the nation’s two best teams last season, but it also played more Football Championship Subdivision foes (17) than any other Power Five conference. (The SEC was second at 11.) The ACC had the weakest strength of schedule of the power leagues. That, plus having four of the eight most damaging non-conference losses, landed it at fourth of the five power conferences.
5. Big 12 Conference
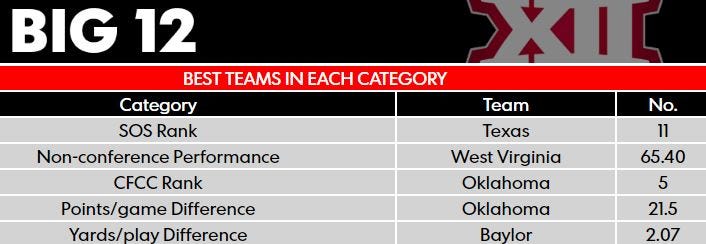
No league can match the Big 12’s consistency. The Big 12 had the identical rank — fourth — in every analysis category. But in 2015 the Big 12 wasn’t consistently outstanding in one area compared to its peers. It also is dragged down by Kansas having by far the worst computer ranking and non-conference performance of any Power Five team. Still, though the Big 12 enters 2016 coming off a season in which it was fifth among Power Five leagues, it’s really, really close.
6. American Athletic Conference
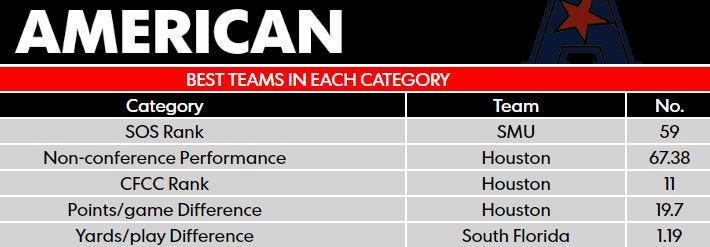
In four of the five metrics used in this analysis, the AAC occupied its own tier, equidistant from the Power Five leagues above and the rest of the Group of Five below. So in the AAC’s case, perception reflects reality. In the composite computer rankings especially, the AAC compares favorably to the company it aspires to keep: It finished 2015 with more teams in the top 36 than the ACC and the Big 12.
7. Mountain West Conference
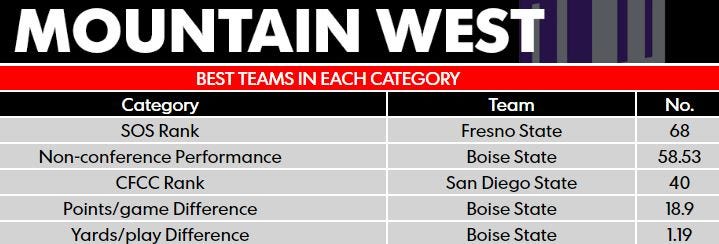
This conference has produced two teams that have reached the top two in the polls and are significant members of the Power Five. As recently as two seasons ago the MWC would have ranked right behind the fifth-strongest conference. But the Mountain West slipped in 2015. Its strength of schedule and non-conference performance were limited and included the two weakest opponents any FBS teams faced, Mississippi Valley State and Savannah State.
8. Mid-American Conference
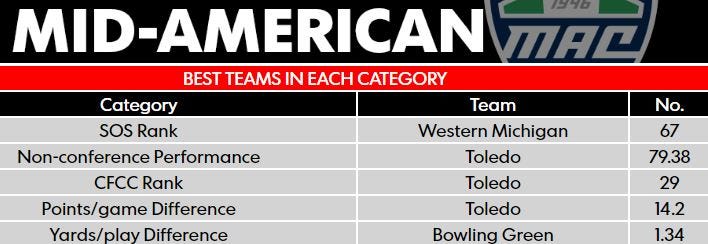
The MAC is one of four conferences that gave up more points per game than it scored and more yards per play than it gained. But it was not without its strengths. For one, Toledo had the best non-conference performance in the FBS. And the MAC is gaining on the Mountain West. The MAC is a leading source of Power Five head coaches, but even as that helps its branding, it hurts its ability to develop competitive consistency.
9. Conference USA
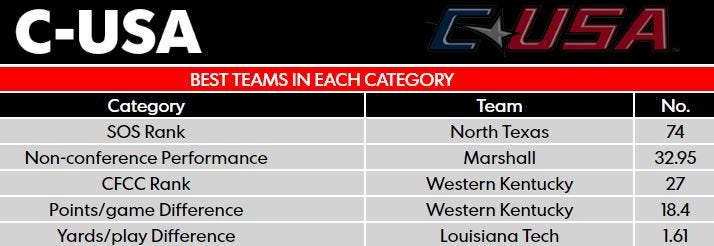
Western Kentucky’s final 2015 computer ranking was the third best of any Group of Five team, and Marshall joined the Hilltoppers in notching a win vs. Power Five opposition. Western Kentucky and Southern Miss were within .07 of a yard in matching Louisiana Tech’s impressive YPP differential. But nine of C-USA’s 13 members finished in the bottom 28 of the FBS in SOS and eight of 13 were in the bottom 28 in the FBS, according to the computer rankings.
10. Sun Belt Conference
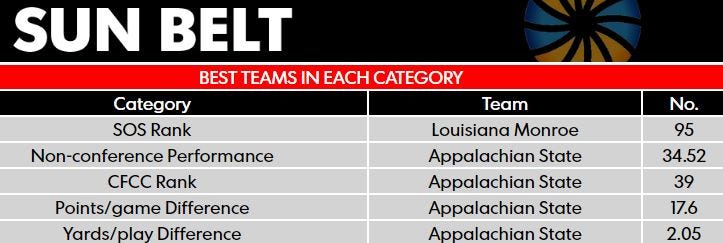
Five of the Sun Belt’s 12 programs have been FBS members for less than five years. There is a reason the Sun Belt is last among FBS conferences. But the league’s expansion effort has been shrewd, and Arkansas State and newcomers Appalachian State and Georgia Southern appear built for sustained success. Still, the computers rank the rest of the league in the bottom 28% of the FBS. And 10 of its 12 finished 2015 between 100 and 126 in SOS. So there is room to grow.
Strength of schedule: Strength of schedule ratings were compiled by Cody Kellner, a PhD student in Applied Technology and Performance Improvement at the University of North Texas. Kellner bases his strength of schedule measurements on the average of each opponent’s individual rating that each team has played up to that point during the current season.
Each team’s individual rating is a reflection of every game result of the current season as well as well as the previous season, factoring the opponent’s rating plus or minus 100 if the result is from the previous season or plus or minus 200 if the result is from the current season. The results from the previous season diminish as the current season progresses. Kellner’s model values a team’s defensive performance over offensive performance. For example, shutting out an opponent 10-0 is weighted more than if a team wins 70-35. The winning team’s score is divided by the total points scored in that game, so if a winning team shuts out its opponent, the metric reads that as the winning team dominated 100% of the game.
Margin of victory is factored in, partly to allow Group of Five schools to make up for relatively weaker schedules by winning in a more decisive fashion. Location of games, injuries and conference affiliation are not considered. This is not a predictive model since it only reflects a season’s results to that point in time. In each conference, team strengths of schedule were summed and then divided to come up with an average SOS for each conference. Conference average results were ranked from highest to lowest value.
Kellner’s web site is kellnerratings.com.
Non-conference performance: Each team in the FBS and each team that played an FBS team in 2015 was given a value based on the final 2015 Sagarin ratings, whose numbers allow apples to apples comparisons of every team. Values in the 2015 data set ranged from 100.92 for Alabama to 14.02 for Savannah State. Teams were awarded or deducted points for victories based on who they defeated or lost to. For example, a non-conference win vs. Alabama (the team with the greatest value) would be worth 100.92 points. A non-conference loss to Alabama would be a -1. Similarly, a win vs. North Carolina State (the team with the 50th greatest value) would be worth 74.72 points, while a loss would be a -26.20, or the distance in the quality from the very best team in the FBS.
Bonus points were awarded for road victories against teams in the top 100 of the Sagarin ratings. A victory on the road vs. a team rated 91-100 provided a 2.5-point bonus. A road win vs. a team in the top 90 provided a 5-point bonus, and so on up to 25-point bonus for defeating a team in the Sagarin top 10.
Every non-conference result for each league was summed to come up with a positive or negative value. That value was then divided by the number of non-conference games played by that league’s respective members. The result was an average number of points earned for non-conference play by each league. Conference average results were ranked from highest to lowest value.
Computer rankings: The final 2015 rankings for every team in the USA TODAY College Football Computer Composite — a ranking of the 128 FBS schools as quantified by five former Bowl Championship Series computer formulas — were organized by conference membership, then summed and averaged. The lower the average, the better the ranking compared to other conferences.
Because Sagarin ratings are involved in the non-conference performance metric, they were omitted in this calculation. The remaining four formulas that drive the Computer Composite — Billingsley, Colley Massey and Wolfe — were included.
Points per game differential: In each conference, every team’s total points scored were summed and divided by the total number of games played. The result was average points per game scored for each league. Next, every team’s total points allowed were summed and divided by the total number of games played. The result was average points per game allowed for each league. Then average points per game allowed were subtracted from average points per game scored.
The result can be a positive or negative value — positive if a league scores more points than it allows and negative if not. Conference average results were ranked from highest to lowest value.
Yards per play differential: In each conference, every team’s total yards gained were summed and divided by the total number of plays run. The result was average yards per play for each league. Next, every team’s total yards allowed were summed and divided by the total number of plays run. The result was average yards per play allowed for each league. Then average yards per play allowed were subtracted from average yards per play gained.
The result can be a positive or negative value — positive if a league gains more yards per play than it allows and negative if not. Conference average results were ranked from highest to lowest value.

